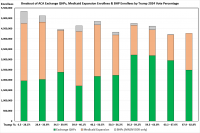
With the pending dire threat to several of these programs (primarily Medicaid & the ACA) from the House Republican Budget Proposal which recently passed, I'm going a step further and am generating pie charts which visualize just how much of every Congressional District's total population is at risk of losing healthcare coverage.
USE THE DROP-DOWN MENU ABOVE TO FIND YOUR STATE & DISTRICT.
16 Million Americans Would Become Uninsured Due to Reconciliation Bill and Loss of Tax Credits; 8.2 Million in Marketplaces Alone
Leaders from State-based Health Insurance Marketplaces, Enrollees, Providers, and Small Business Highlight Potential, Devastating Impacts
(Washington, DC) The Congressional Reconciliation bill and loss of federal tax credits would result in 16 million Americans losing health coverage, including 8.2 million enrolled in Health Insurance Marketplaces. By stripping millions of lives from the Marketplaces, health care will be more expensive, harder to access, create a strain on health care systems, and hurt small businesses.
Governor Kathy Hochul today released new data showing the massive impact the GOP’s ‘Big Ugly’ Reconciliation Bill would have on New York families. The latest bill threatens to severely disrupt health coverage for millions of New Yorkers. In addition to increasing the number of uninsured by 1.5 million and stripping $13.5 billion in annual funding from New York’s healthcare system, the bill would trigger steep increases in private health insurance premiums for vulnerable New Yorkers and impose excessive burdens on consumers enrolling through NY State of Health, the State’s official health plan marketplace.
With potential Federal cuts to Medicaid on the horizon, renewing enhanced premium tax credits to ensure affordable insurance through the marketplace takes on greater significance
AUGUSTA— The Maine Department of Health and Human Services (DHHS) Office of the Health Insurance Marketplace (OHIM) today announced its support for renewing the enhanced premium tax credits for consumers of the health insurance marketplace.
The enhanced premium tax credits, which were first implemented in 2021 through the American Rescue Act and extended in the Inflation Reduction Act are set to expire at the end of this year unless Congress acts. Allowing these federal tax credits to expire will result in higher health insurance premiums for Maine consumers, potentially putting health coverage out of reach for thousands of Mainers. Overall, the enhanced tax credits are saving Mainers a conservative estimate of nearly $90 million in health care premium savings this year.
Covered California expresses deep concern regarding the proposed health provisions in the reconciliation bill moving through the House of Representatives.
If enacted, the legislation would have devastating consequences to the health, well-being and financial security of hundreds of thousands of Californians who would lose access to affordable health insurance. It would also lead to greater strain on the health care system and increased costs for individuals and businesses throughout the state.
With the House Republican budget bill having made it past its second significant hurdle last night (the House Budget Committee vote), it's time tot ake a cold, hard look at just what the impact of the bill will be in pure partisan terms.
The logic Congressional Republicans (or at least Donald Trump, who pretty much has complete control over the Congressional Republican hivemind) seem to be going with is that targeting the Medicaid expansion population is good politics for them because:
UPDATED 5/22/25: Welp. House Republicans did indeed follow through with passing their horrific (and disgustingly-titled) "One Big Beautiful Bill" Act which will effectively repeal the bulk of the ACA without officially repealing it, and that's just for starters.
The final vote was 215 - 214, with every Republican except a handful voting for it (and the two who voted against it openly admitted to the NY Times that they would have voted for it if their votes had been needed), and every Democrat voting against it. There were 2 Republican "no" votes...but both of those were only because they wanted the final bill to be even more draconian.
Next up: Premiums, Advance Premium Tax Credits (APTC) and Cost Sharing Reduction (CSR) assistance.
Nationally, the average unsubsidized premiums for 2025 exchange-based Open Enrollment Period enrollees is $619/month, up $14 or just 2.3% from $605 last year.
This is a noteworthy because 2025 ACA exchange premiums "should" have increase by more like 6-7% on average. This discrepancy is mostly because that 6-7% assumed that 100% of those enrolled in each plan in 2024 renewed the exact same policy (without any attrition or additional enrollment), which of course is never the case...even if total QHP selections were identical year over year, not all of the enrollees would be the same people, millions of them would switch to different policies and so on.
New Hampshire has the lowest average ACA premiums for the second year in a row at $469/month, while West Virginia once again has by far the highest at a whopping $1,170/month...up $51 from last year. Again, these are the unsubsidized average prices.
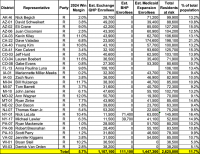
Now it's time to move on to the actual demographic breakout of 2025 Open Enrollment Period (OEP) Qualified Health Plan (QHP) enrollment.
First up: Breaking out new enrollees vs. existing enrollees who either actively re-enroll in an exchange plan for another year or who passively allow themselves to be automatically renewed into their current plan (or to be "mapped" to a similar plan if the current one is no longer available).
Nationally, 17% of all exchange QHP enrollees were new this year. The other 83% are current enrollees who signed up for another year, either actively (39%) or passively (45%).
New York had the lowest percent of new enrollees (11%), while Minnesota had the highest at 28%.
As I've noted before, there's still a massive divide between federal and state-based exchanges when it comes to active renewals: Over 45% of federal exchange states actively renewed (which is good!)...but only 22% of state-based exchange enrollees did. Active renewals range from just 8% in Rhode Island & DC to 58% in Utah.
The most recent press release from the Centers for Medicare & Medicaid Services (CMS) which included actual enrollment data about the 2025 ACA Open Enrollment Period (OEP) came out back on January 17, 2025 as one of the final communications from the outgoing Biden/Harris Administration.
This press release didn't include any accompanying Public Use Files (PUFs) since it only included semi-final enrollment data for the 2025 period.
Final top-line numbers were available for the 31 states hosted via the Federally Facilitated Marketplace (FFM), HealthCare.Gov...but the enrollment data was still preliminary for the 20 State-Based Marketplaces (SBEs), several of which hadn't even wrapped up Open Enrollment yet (including CA, DC, MA, NJ, NY, RI & VA). A few states final enrollment deadlines wouldn't hit until January 31st, over a week into the new Musk/Trump Regime.