

Vermont: Effectuated ACA enrollment down 11.5% as of April; 3,700 have lost coverage so far
Fri, 05/22/2026 - 11:24am
Once again: The true measure of ACA healthcare coverage enrollment isn't how many people select policies during the Open Enrollment Period, it's how many actually have those policies in effect (aka "effectuated enrollment")...as well as how comprehensive that coverage is, of course.
Yesterday, Pluribus News published a new story about effectuated enrollment across a dozen or so states (the reporters actually consulted with me several times about their data and how to present it, although I somehow didn't end up getting credited in the final version).
In any event, most of the material discussed in their story is pretty much everything I've been writing about and warning about for months, and even the enrollment data they acquired is the same as what I have in most cases. They were, however, able to get ahold of hard effectuation numbers for three states which I didn't already know: Arkansas, Nevada and Vermont.
With that in mind, here's what Vermont's enrollment looks like as of April 15th compared compared with the official CMS monthly effectuated reports from prior years. It's important to note that the Pluribus story only has the effectuated number for April, so I'm assuming it was proportionately similar for January - March:
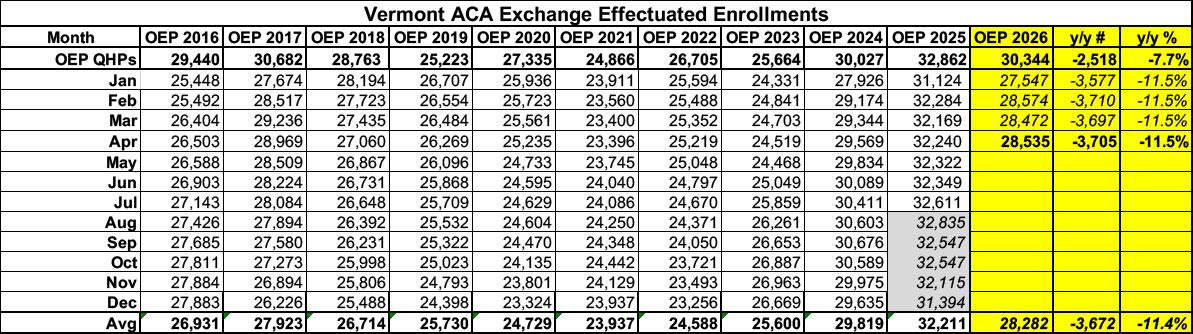
As of April, Vermont's effectuated enrollment stood at 28,535 people, down 11.5% vs the same point a year earlier.
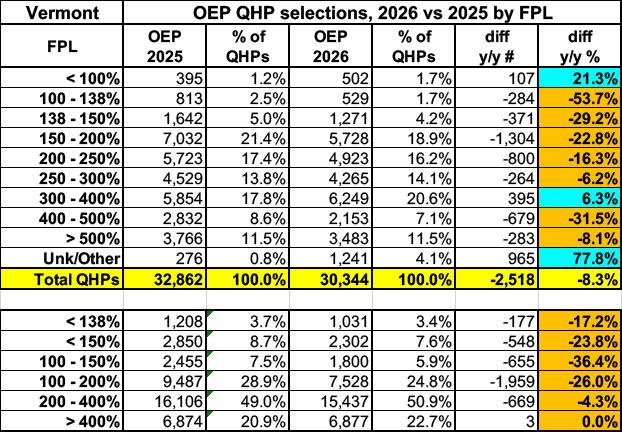
Here's the breakout of Open Enrollment Period (OEP) plan selections by income bracket. Unlike most states, enrollment below the poverty line actually increased this year, although the raw numbers show that this is pretty much a rounding error. Just about every other income bracket also saw enrollment plummet except for 300 - 400% FPL range, likely due to folks who normally earn slightly more than 400% FPL tweaking their projected income to come in just below the Subsidy Cliff threshold (and now scrambling to make sure that their actual MAGI income doesn't go above it for the year).
Here's the breakout by metal level, both unadjusted as well as adjusted by Cost Sharing Reduction (CSR) category. I should note that for the latter (grey cells in the 2nd table), I'm basing this on the average breakout of CSR categories across the 21 states which a) the Centers for Medicare & Medicaid Services (CMS) has provided hard data for and b) which have expanded Medicaid under the ACA:
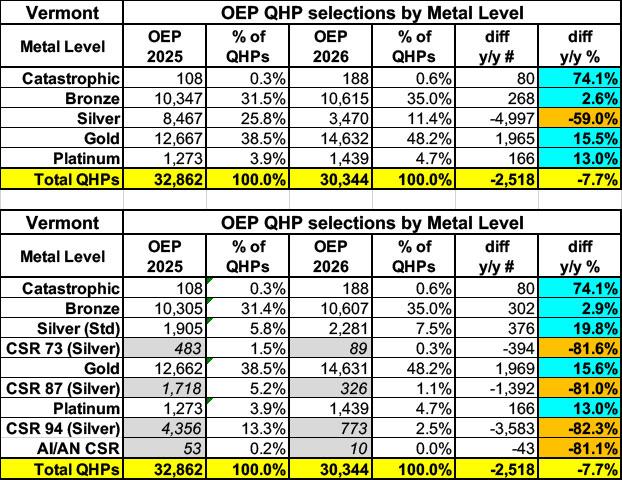
While there has definitely been a "buying down' trend in Vermont, it wasn't nearly as strong as in most states I've looked at so far--there's been more of a "ripple effect" here, with people downgrading one tier but not always two or three...in fact, the largest increase in enrollment is to standard Silver (not including Catastrophic plans, but again, the numbers are nominal).
Vermont is a state which already has Premium Alignment pricing and which also has their own supplemental state subsidies in place, which muddies the water somewhat as well.
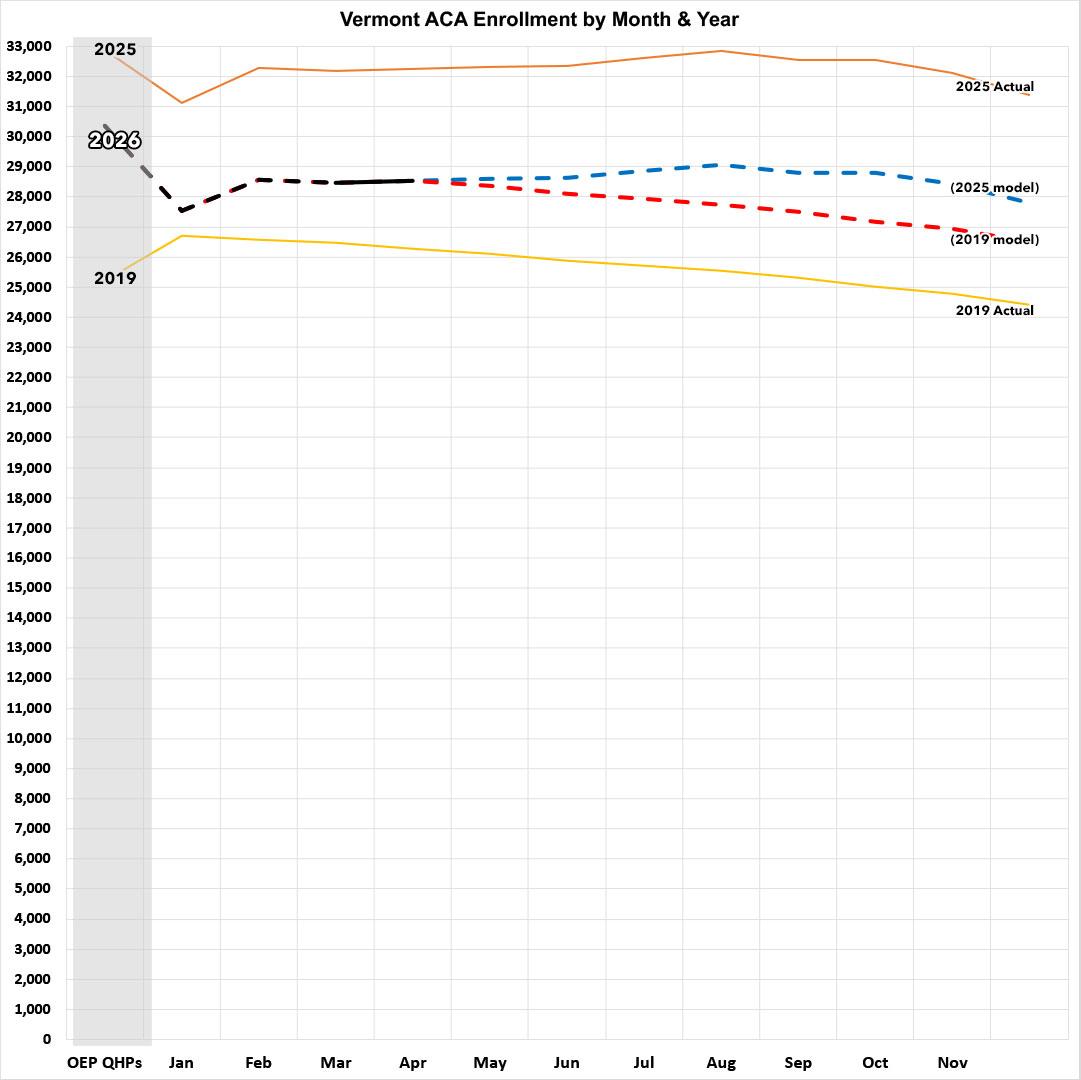
Here's what effectuated enrollment will look like for the rest of the year in Vermont assuming it follows either the 2025 or 2019 patterns:
- If the rest of the year follows the 2025 pattern, effectuations will end December at around 27,700 and will average around 28,500 for the year...down 11.5% compared to 2025.
- If the rest of the year follows the 2019 pattern, effectuations will be at around 26,500 by December, and the average for the year will be around 27,800...down 13.8% y/y. That would mean more than 4,400 fewer people having ACA healthcare coverage than last year.
Here's where things stand so far...
- Arkansas: OEP down 3.8%; May effectuations down 5.3%
- California: OEP down 2.6%; February effectuations down 8.5%
- Colorado: OEP down 1.9%; March effectuations down 6.1%
- Georgia: OEP down 12.3%; April effectuations down 28.1%
- Maryland: OEP up 3.4%; April effectuations down 6.3%
- Massachusetts: OEP up 3.7%; April effectuations down 4.3%
- Minnesota: OEP down 8.1%; February effectuations down 8.6%
- Nevada: OEP down 5.8%; May effectuations down 11.1%
- New Jersey: OEP down 0.8%; April effectuations down 11.6%
- New Mexico: OEP up 18.1%; May effectuations up 5.6%
- New York: OEP down 4.9%; May effectuations down 8.7%
- Pennsylvania: OEP up 1%; May effectuations down 5.2%
- Vermont: OEP down 7.7%; April effectuations down 11.5%
- Washington: OEP down 5.9%; February effectuations down 15.7%
In terms of year over year average monthly effectuated enrollment as of the months of the latest data:
- Arkansas: Down ~7,700
- California: Down ~110,000
- Colorado: Down ~13,400
- Georgia: Down ~370,000
- Maryland: Up ~7,000
- Massachusetts: Up ~1,600
- Minnesota: Down ~10,000
- Nevada: Down ~11,500
- New Jersey: Down ~57,000
- New York: Down ~14,500
- New Mexico: Up ~7,200
- Pennsylvania: Down ~2,300
- Vermont: Down ~3,700
- Washington: Down ~33,000
- Total across 14 states: Down at least 617,000
Advertisement